by
Free tool · Cost, volume, profitSame maths as LedgerIQ

Break even calculator: break-even point, contribution and margin of safety

Enter your price, your variable cost per unit and your fixed costs, or just your sales and cost totals, and this break-even calculator shows how many sales cover your costs, how much each sale contributes, how far sales could fall before you make a loss, and what you need to sell for the profit you want.

Every sum runs in your browser. Nothing you type is sent to us or saved.

What do you know?
Your figures
Optional

Sole trader? Your drawings are not a business cost. Put the income you need as the target profit.

ResultCost, volume, profit
Break-even point, per month
2,889 units

Units rounded up to the next whole sale; money to the penny. Runs in your browser; nothing is sent or saved.

Your real break-even, from the ledger. LedgerIQ splits your actual costs into fixed and variable and finds the break-even for you.

See how

LedgerIQ by ReconcileIQ

Break-even from your books, not a guess at your costs

The hard part of break-even is knowing which costs are fixed and which are variable. LedgerIQ reads a general ledger, from Xero, QuickBooks, Sage, Pandle or any other platform, or live from IQ Books, and works it out from the actual transactions.

01

Break-even and CVP, from the ledger

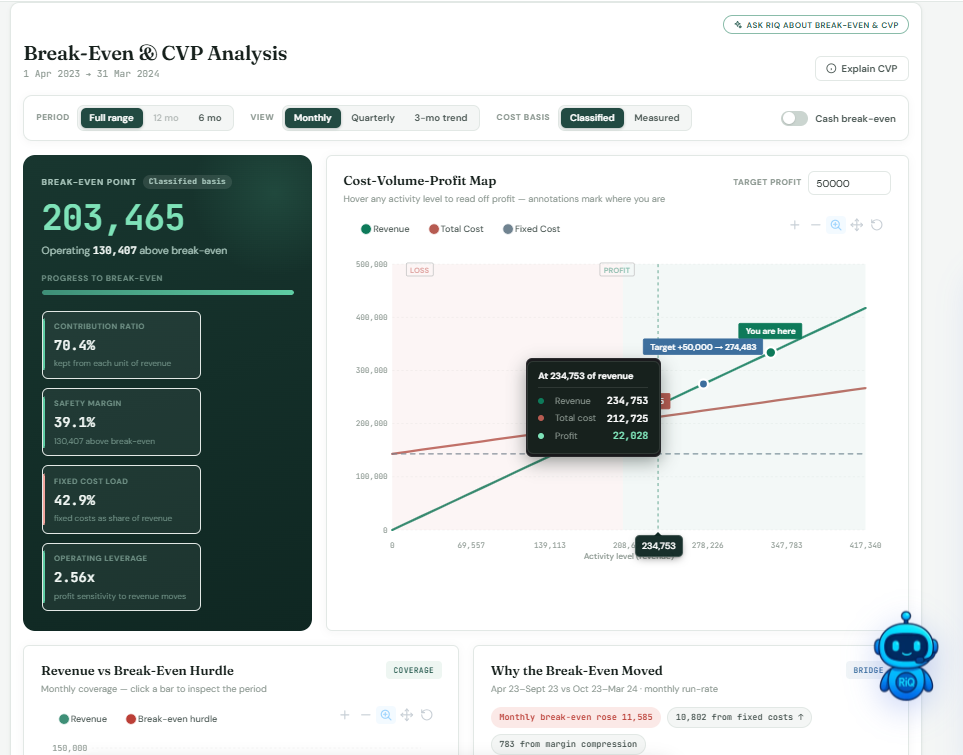
LedgerIQ’s Break-Even and CVP module finds the break-even sales, the contribution ratio, the margin of safety, the fixed cost load and the operating leverage for the period, and draws the cost-volume-profit map with a target profit. Costs are split into fixed and variable from your account classification, or measured from how each cost actually moved with sales month by month.

  • Classified or measured cost behaviour, fixed, semi-variable and variable
  • A cash break-even that leaves out depreciation and amortisation
  • Target profit on the same chart
  • One of 44 analysis modules from the same upload
1,000 free credits to start
LedgerIQ · Break-Even and CVP
LedgerIQ Break-Even and CVP analysis: break-even point of 1,136,035 with operations 426,394 above it, a 47.7% contribution ratio, a 27.3% safety margin and a cost-volume-profit map with a target profit

02

What if the price went up 5%?

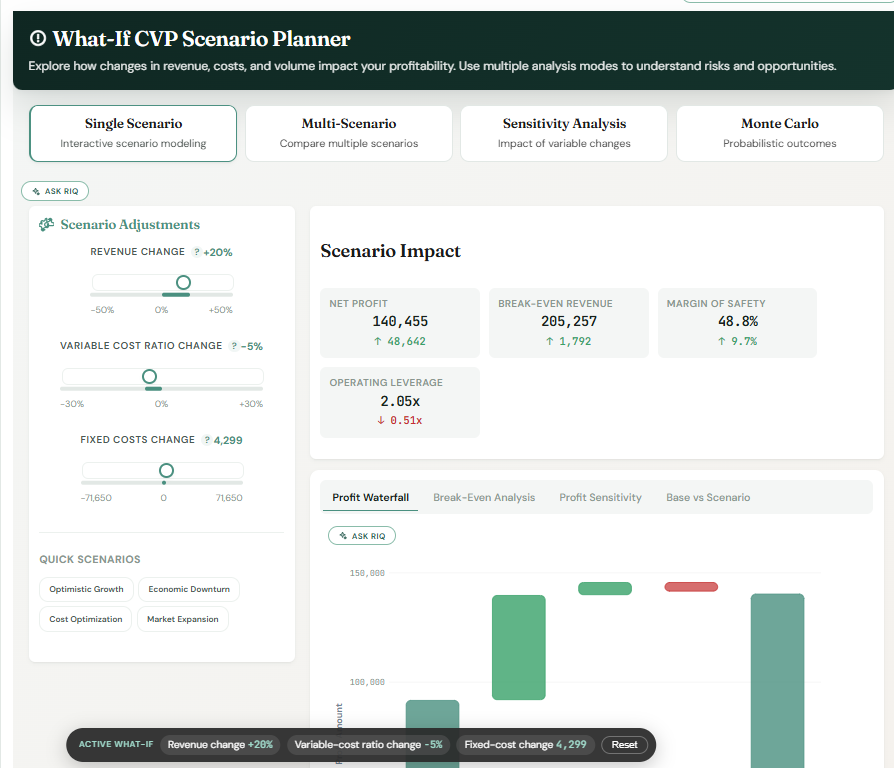
The What-If Lab moves the levers this calculator holds still: selling price, units sold, cost per unit and fixed overheads. It shows the profit bridge from today to the scenario, the new break-even sales, the contribution per pound and the margin of safety, with compare, sensitivity and risk views on the same figures.

  • Price, volume, unit cost and overhead levers
  • A profit bridge, one step per lever
  • Sensitivity and risk views on the same scenario

More about LedgerIQ financial analysis.

LedgerIQ · What-If Lab
LedgerIQ What-If Lab: a 5% price rise and 3% fewer units add £53,400 of operating profit, with break-even sales of £1,079,752, a contribution of 50p per £1 of sales and a 32.1% margin of safety

Guide

How to calculate the break-even point

The break-even formula in units and in sales, contribution margin, the margin of safety, how to read a break-even chart and where break-even analysis stops being reliable.

What is the break-even point?

The break-even point is the level of sales where total revenue equals total costs: no profit and no loss. Fixed costs, such as rent, salaries, insurance and software, stay the same whatever you sell; variable costs, such as materials, stock and card fees, rise with each sale. Every sale first helps pay the fixed costs; once they are covered, what each further sale contributes is profit.

The break-even formula

Break-even point (units) = fixed costs ÷ (selling price per unit − variable cost per unit)

The bracket is the contribution per unit. A café with £6,500 of fixed costs a month sells coffee at £3.20 that costs £0.95 to make: each cup contributes £2.25, and £6,500 ÷ £2.25 = 2,888.9 cups, so it needs 2,889 cups a month to break even. Round up, because you cannot sell part of a cup.

The break-even point formula in sales

Break-even sales = fixed costs ÷ contribution margin ratio

Use this when you sell many products at different prices. If variable costs are 40% of your sales, the contribution margin ratio is 60%, and £18,000 of fixed costs a month needs £18,000 ÷ 0.6 = £30,000 of sales to break even. In units mode the two formulas agree: 2,888.9 cups at £3.20 is £9,244.44 of sales.

How to calculate break even, step by step

  1. Add up your fixed costs for a period, a month or a year.
  2. Work out the variable cost of one sale, or your total variable costs for the same period.
  3. Take the variable cost from the price to get the contribution per unit, or divide total contribution by sales for the ratio.
  4. Divide fixed costs by the contribution per unit for break-even units, or by the ratio for break-even sales.

The contribution margin formula and ratio

Contribution margin = selling price − variable cost and contribution margin ratio = contribution ÷ sales

Contribution margin is what each sale leaves towards fixed costs and profit. It is not the same as gross margin: gross margin uses the cost of sales in your accounts, which can include fixed production costs and leave out variable selling costs such as commission and card fees. For break-even, you need the contribution figure. Our profit margin calculator works out gross margin and markup.

How to calculate margin of safety: the formula

Margin of safety = expected sales − break-even sales and, as a percentage, (expected sales − break-even sales) ÷ expected sales × 100

Margin of safety means how far sales can fall before you make a loss. The café expects 4,200 cups a month against a break-even of 2,888.9: a margin of safety of 1,311 cups, £4,195.56 of sales, or 31.22%. The margin of safety formula in units and in percentage terms is the same one taught in GCSE and A level business.

How to read a break-even graph

A break-even chart, also called a break-even graph or break-even diagram, puts units or sales along the bottom and pounds up the side. The fixed cost line is flat. The total cost line starts where the fixed costs are and rises by the variable cost of each unit. The sales revenue line starts at zero and rises by the price. Where revenue crosses total costs is the break-even point; the wedge before it is a loss and the wedge after it is profit. The horizontal gap between your expected sales and the break-even point is the margin of safety. The calculator draws the chart for your figures.

Target profit and operating leverage

To find the sales needed for a profit, add the profit to the fixed costs before dividing: units for a target profit = (fixed costs + target profit) ÷ contribution per unit. Operating leverage, contribution divided by profit, shows how sharply profit moves with sales: at 3×, a 10% rise in sales lifts profit by 30%.

How long to break even

If you have a one-off cost to recover, such as fitting out a unit or buying equipment, the break-even period is that cost divided by the profit you expect each month once you are trading above break-even. £36,000 recovered from £7,200 a month of profit takes 5 months.

Break-even in Excel

With fixed costs in B1, the price in B2 and the variable cost per unit in B3: break-even units =ROUNDUP(B1/(B2-B3),0), break-even sales =B1/((B2-B3)/B2). With expected units in B4, the margin of safety is =(B4-B1/(B2-B3))/B4, formatted as a percentage.

What break-even analysis assumes

The formula assumes a constant price and variable cost per unit at every volume, fixed costs that do not step up as you grow, and a steady mix of products. Real businesses discount, buy in bulk and hire as they grow, so treat break-even as a guide for a sensible range of sales. If you are VAT registered, use prices and costs before VAT; if you are not, use your selling prices as they are and include the VAT you pay on costs.
Worked examples

Two UK businesses, finding their break-even

One works per unit, the other from its monthly totals. Both are VAT registered, so every figure is before VAT. Type them into the calculator above to follow along.

A café · per unit

How many coffees a month?

A flat white sells for £3.20 before VAT; beans, milk, cup and card fee come to £0.95. Rent, wages, rates and insurance are £6,500 a month. The café expects to sell 4,200 cups.

Contribution per cup (£3.20 − £0.95)£2.25
Contribution margin ratio70.31%
Break-even (£6,500 ÷ £2.25)2,889 cups
Break-even sales£9,244.44
Profit at 4,200 cups£2,950.00
Margin of safety31.22%

For £4,000 of profit a month it needs (£6,500 + £4,000) ÷ £2.25 = 4,667 cups.

A joinery workshop · from sales totals

How much work a month?

Sales are £42,000 a month; timber, fixings and subcontract labour that move with each job are £16,800, 40% of sales. Fixed costs are £18,000 a month. Fitting out the workshop cost £36,000.

Contribution margin ratio (£25,200 ÷ £42,000)60%
Break-even sales (£18,000 ÷ 60%)£30,000.00
Profit at £42,000 of sales£7,200.00
Margin of safety28.57%
Time to recover the £36,000 fit-out5 months

Sales could fall by £12,000 a month before the workshop made a loss.

Questions

Break-even, answered

About the break-even point and formula, contribution margin, the margin of safety and break-even charts, and what LedgerIQ does with your real costs.

What is the break-even point?

The break-even point is the level of sales at which a business makes neither a profit nor a loss: sales exactly cover fixed costs and variable costs. Below it you make a loss; every sale above it adds its contribution to profit. It can be measured in units sold or in pounds of sales.

How do you calculate break-even?

Work out the contribution per unit, which is the selling price minus the variable cost of one unit. Then divide your fixed costs for the period by that contribution. A café with £6,500 of fixed costs a month, selling coffee at £3.20 that costs £0.95 to make, contributes £2.25 a cup and breaks even at 6,500 ÷ 2.25 = 2,889 cups a month.

What is the break-even formula?

Break-even point in units = fixed costs ÷ (selling price per unit minus variable cost per unit). Break-even point in sales = fixed costs ÷ contribution margin ratio, where the ratio is contribution divided by sales. Both give the same answer: units at break-even times the price equals break-even sales.

How do you calculate break-even in sales value?

Divide fixed costs by the contribution margin ratio. If variable costs are 40% of sales, each pound of sales contributes 60p, and £18,000 of fixed costs a month needs £18,000 ÷ 0.6 = £30,000 of sales to break even. Use this when you sell many products at different prices and know your totals rather than per-unit figures.

What is contribution margin?

Contribution margin is what each sale leaves after its variable costs, the costs that rise and fall with sales, such as materials, stock and card fees. It is what contributes towards fixed costs and then profit. Per unit, it is the selling price minus the variable cost per unit: a £3.20 coffee costing £0.95 to make contributes £2.25.

What is the contribution margin ratio?

The contribution margin ratio is contribution divided by sales, shown as a percentage: the share of every pound of sales left to cover fixed costs. A £2.25 contribution on a £3.20 coffee is a 70.31% ratio. Break-even sales are fixed costs divided by this ratio.

What is the difference between contribution margin and gross margin?

Contribution margin takes off only variable costs. Gross margin takes off the cost of sales as it appears in the accounts, which can include some fixed costs, such as production wages paid whatever the volume, and leaves out variable selling costs, such as card fees or commission. Break-even analysis needs the contribution figure.

What is the margin of safety and how is it calculated?

The margin of safety is how far sales can fall before the business stops making a profit. In units, it is expected sales minus break-even sales; as a percentage, divide that by expected sales. Selling 4,200 cups against a break-even of 2,889 is a margin of safety of 1,311 cups, or 31.22%. It is the same formula taught in GCSE and A level business.

How do I draw a break-even chart?

Put units or sales along the bottom and pounds up the side. Draw fixed costs as a flat line, total costs as a line starting at fixed costs and rising by the variable cost per unit, and sales revenue as a line from zero rising by the price. Where revenue crosses total costs is the break-even point; the gap below it is a loss and above it is profit. The calculator draws this chart for your figures.

Is there a break-even formula in Excel?

Yes, you write it yourself. With fixed costs in B1, the price in B2 and the variable cost per unit in B3, break-even units are =ROUNDUP(B1/(B2-B3),0) and break-even sales are =B1/((B2-B3)/B2). Add expected units in B4 and the margin of safety is =(B4-B1/(B2-B3))/B4, formatted as a percentage.

Is 100% profit breaking even?

No. Breaking even means a profit of zero: sales just cover all your costs. A 100% markup means the selling price is double the variable cost, which is a contribution, not a profit; you still need enough sales at that markup to cover your fixed costs before you make any profit at all.

How long will it take to break even?

If you have a one-off set-up cost to recover, such as fitting out a shop, divide it by the profit you expect each month once trading is above break-even. £36,000 of set-up costs recovered from £7,200 of profit a month takes 5 months. Enter the set-up cost in the calculator to see the time for your figures.

What are the limitations of break-even analysis?

It assumes the price and the variable cost per unit stay the same at every volume, that fixed costs do not step up as you grow, and that the mix of products stays the same. In practice discounts, bulk buying and extra staff change those lines, so treat break-even as a guide for a sensible range of sales rather than an exact figure.

Should I include VAT in a break-even calculation?

If you are VAT registered, no: use prices and costs before VAT, because the VAT you charge is paid to HMRC and the VAT on your costs is reclaimed. If you are not VAT registered, use your selling prices as they are and include the VAT you pay on costs, because you cannot reclaim it.

Does this calculator store or send my figures?

No. Every calculation runs in your browser. Nothing you type is sent to ReconcileIQ or anyone else, and nothing is saved when you close the page.

Find your real break-even, from your own books.

LedgerIQ reads your general ledger from any platform, splits your costs into fixed and variable, and shows your break-even, margin of safety and what-if scenarios. Every new account starts with 1,000 free credits, enough for a full analysis.